Using the grid
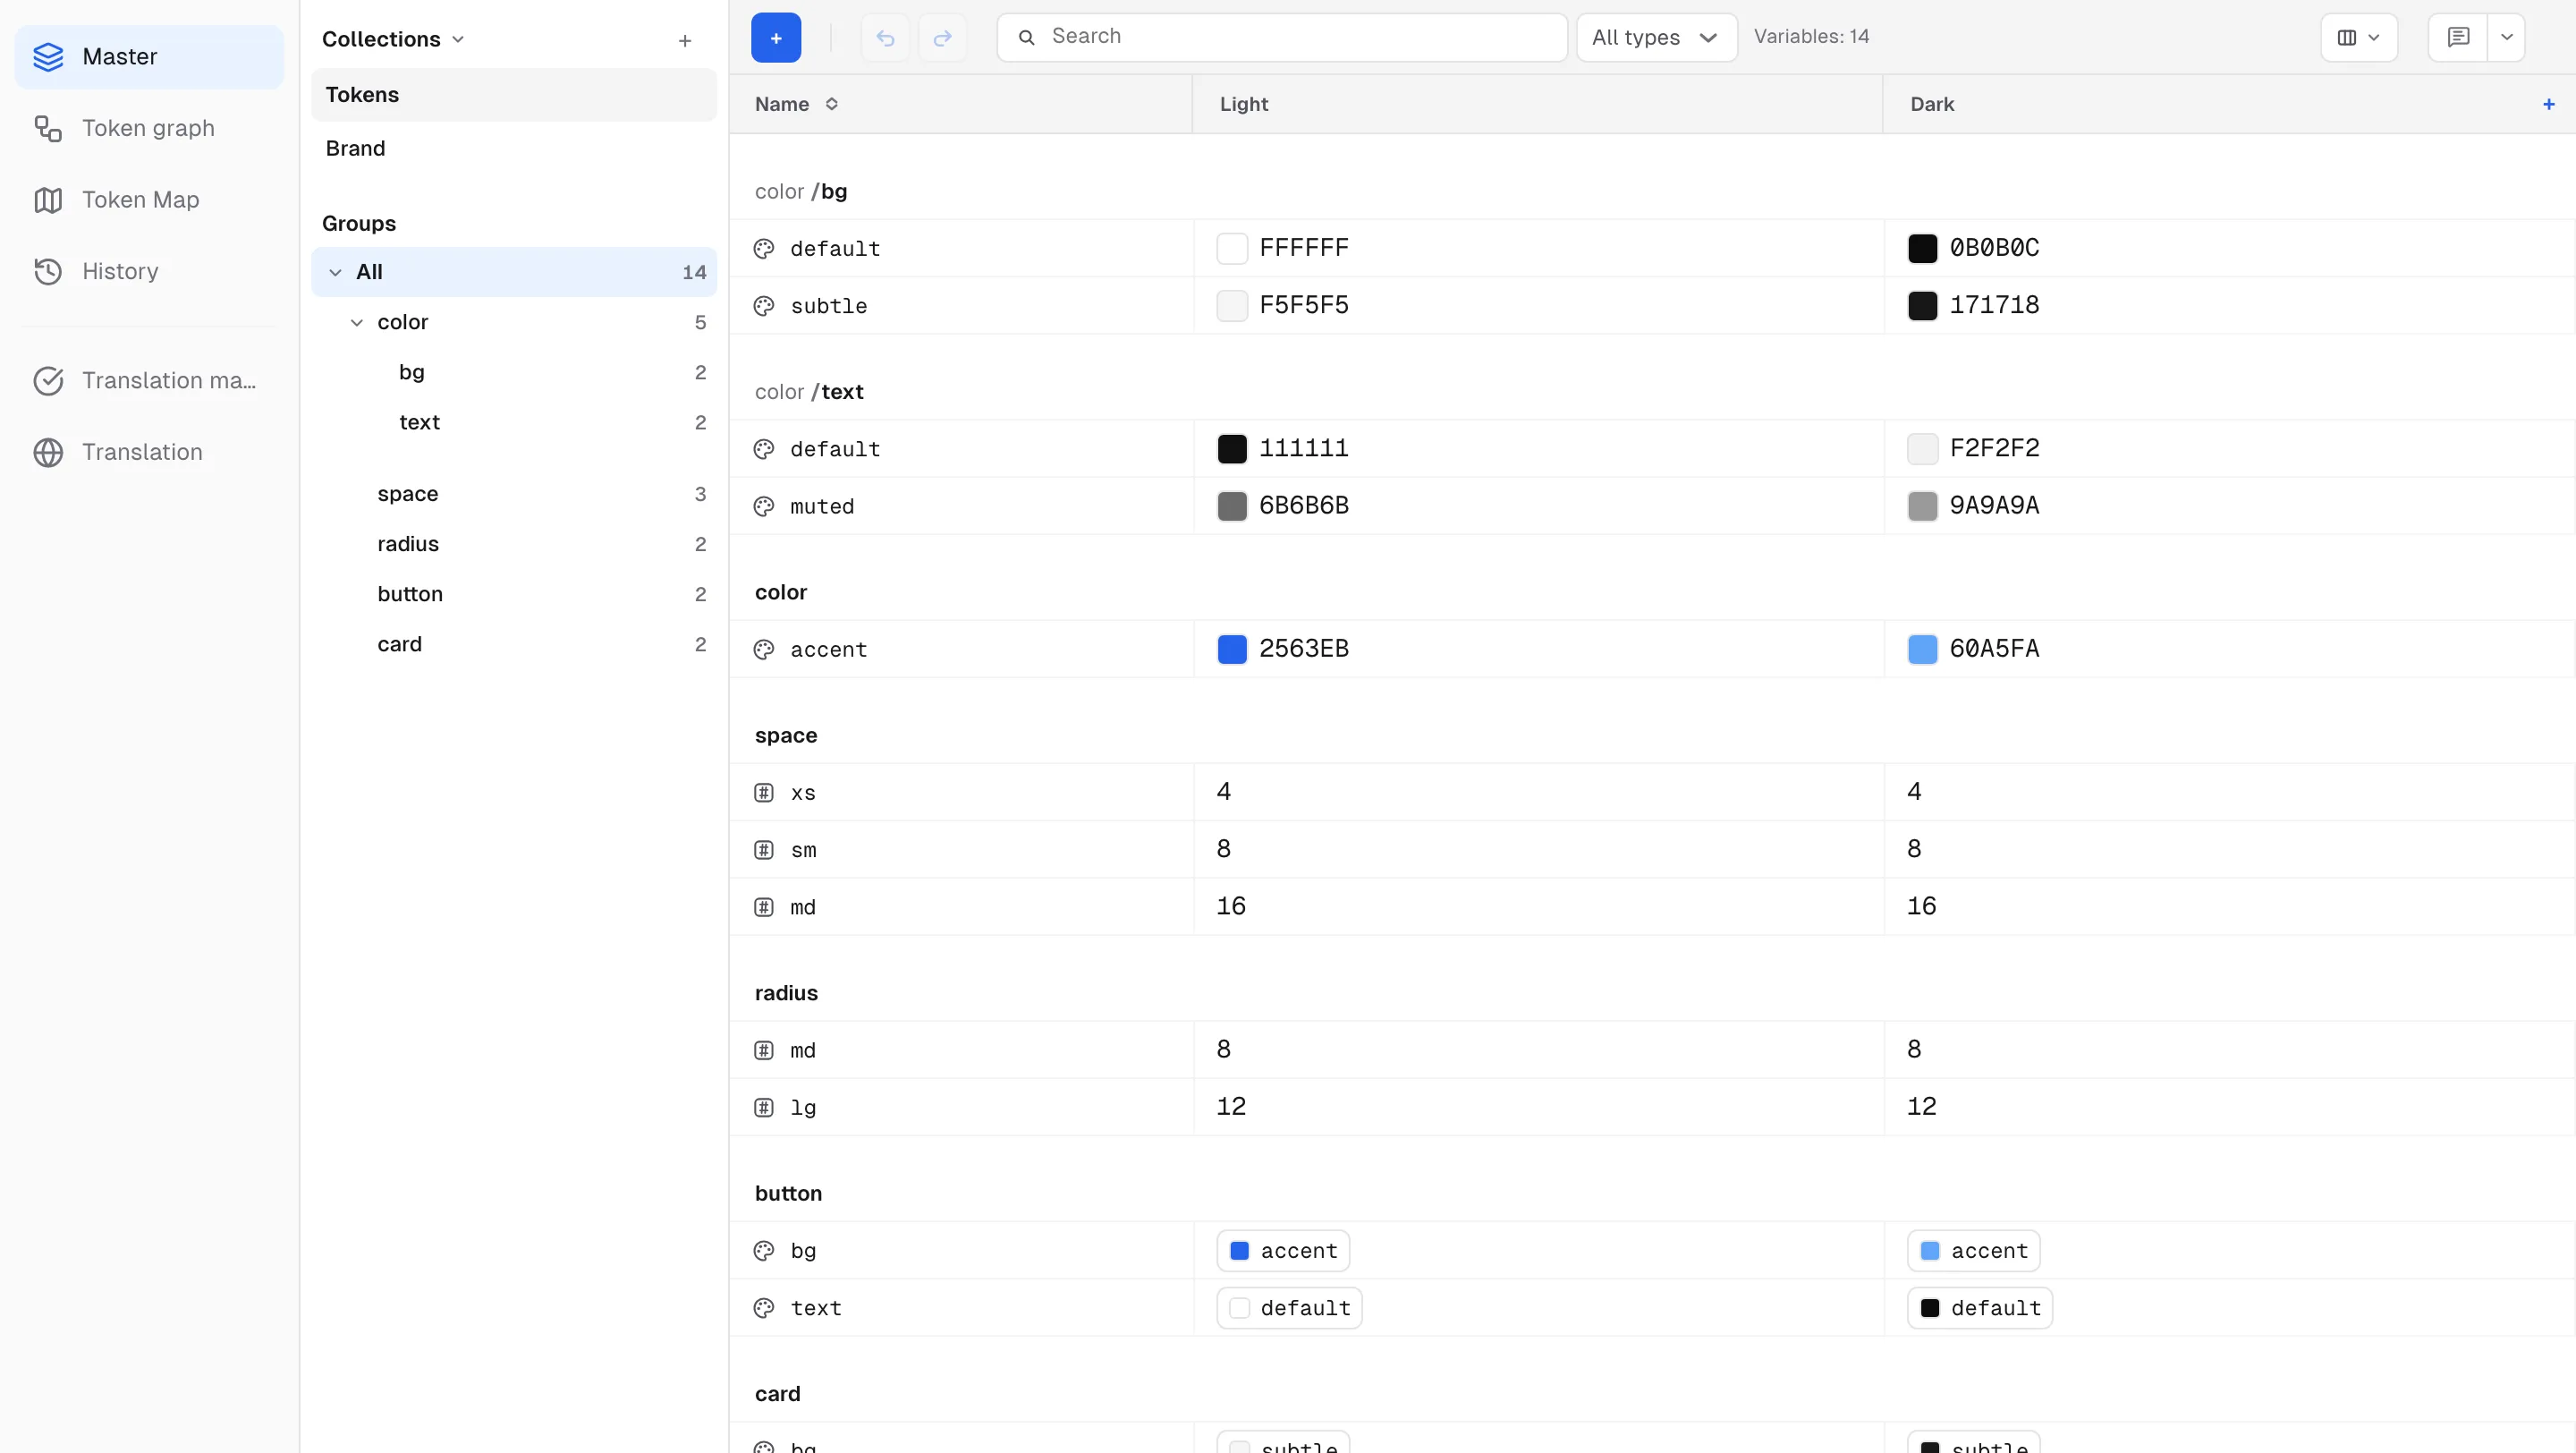
The master grid is the variable editor in a project’s Master tab. Each row is one variable; there is one value column per mode (light/dark, languages, and so on). Changes made in the grid reach Figma when you press Sync in the plugin.
Collections and groups
- Switch collections from the Collections list in the left sidebar, and create one with the + button (New collection). Right-click a collection for Rename / Export this collection / Delete.
- Click the Collections header in the sidebar to open the Collections order menu — Creation order (default) or Name (A→Z). A collection order you rearranged in Figma’s panel can’t be read by plugins, so it isn’t imported.
- A
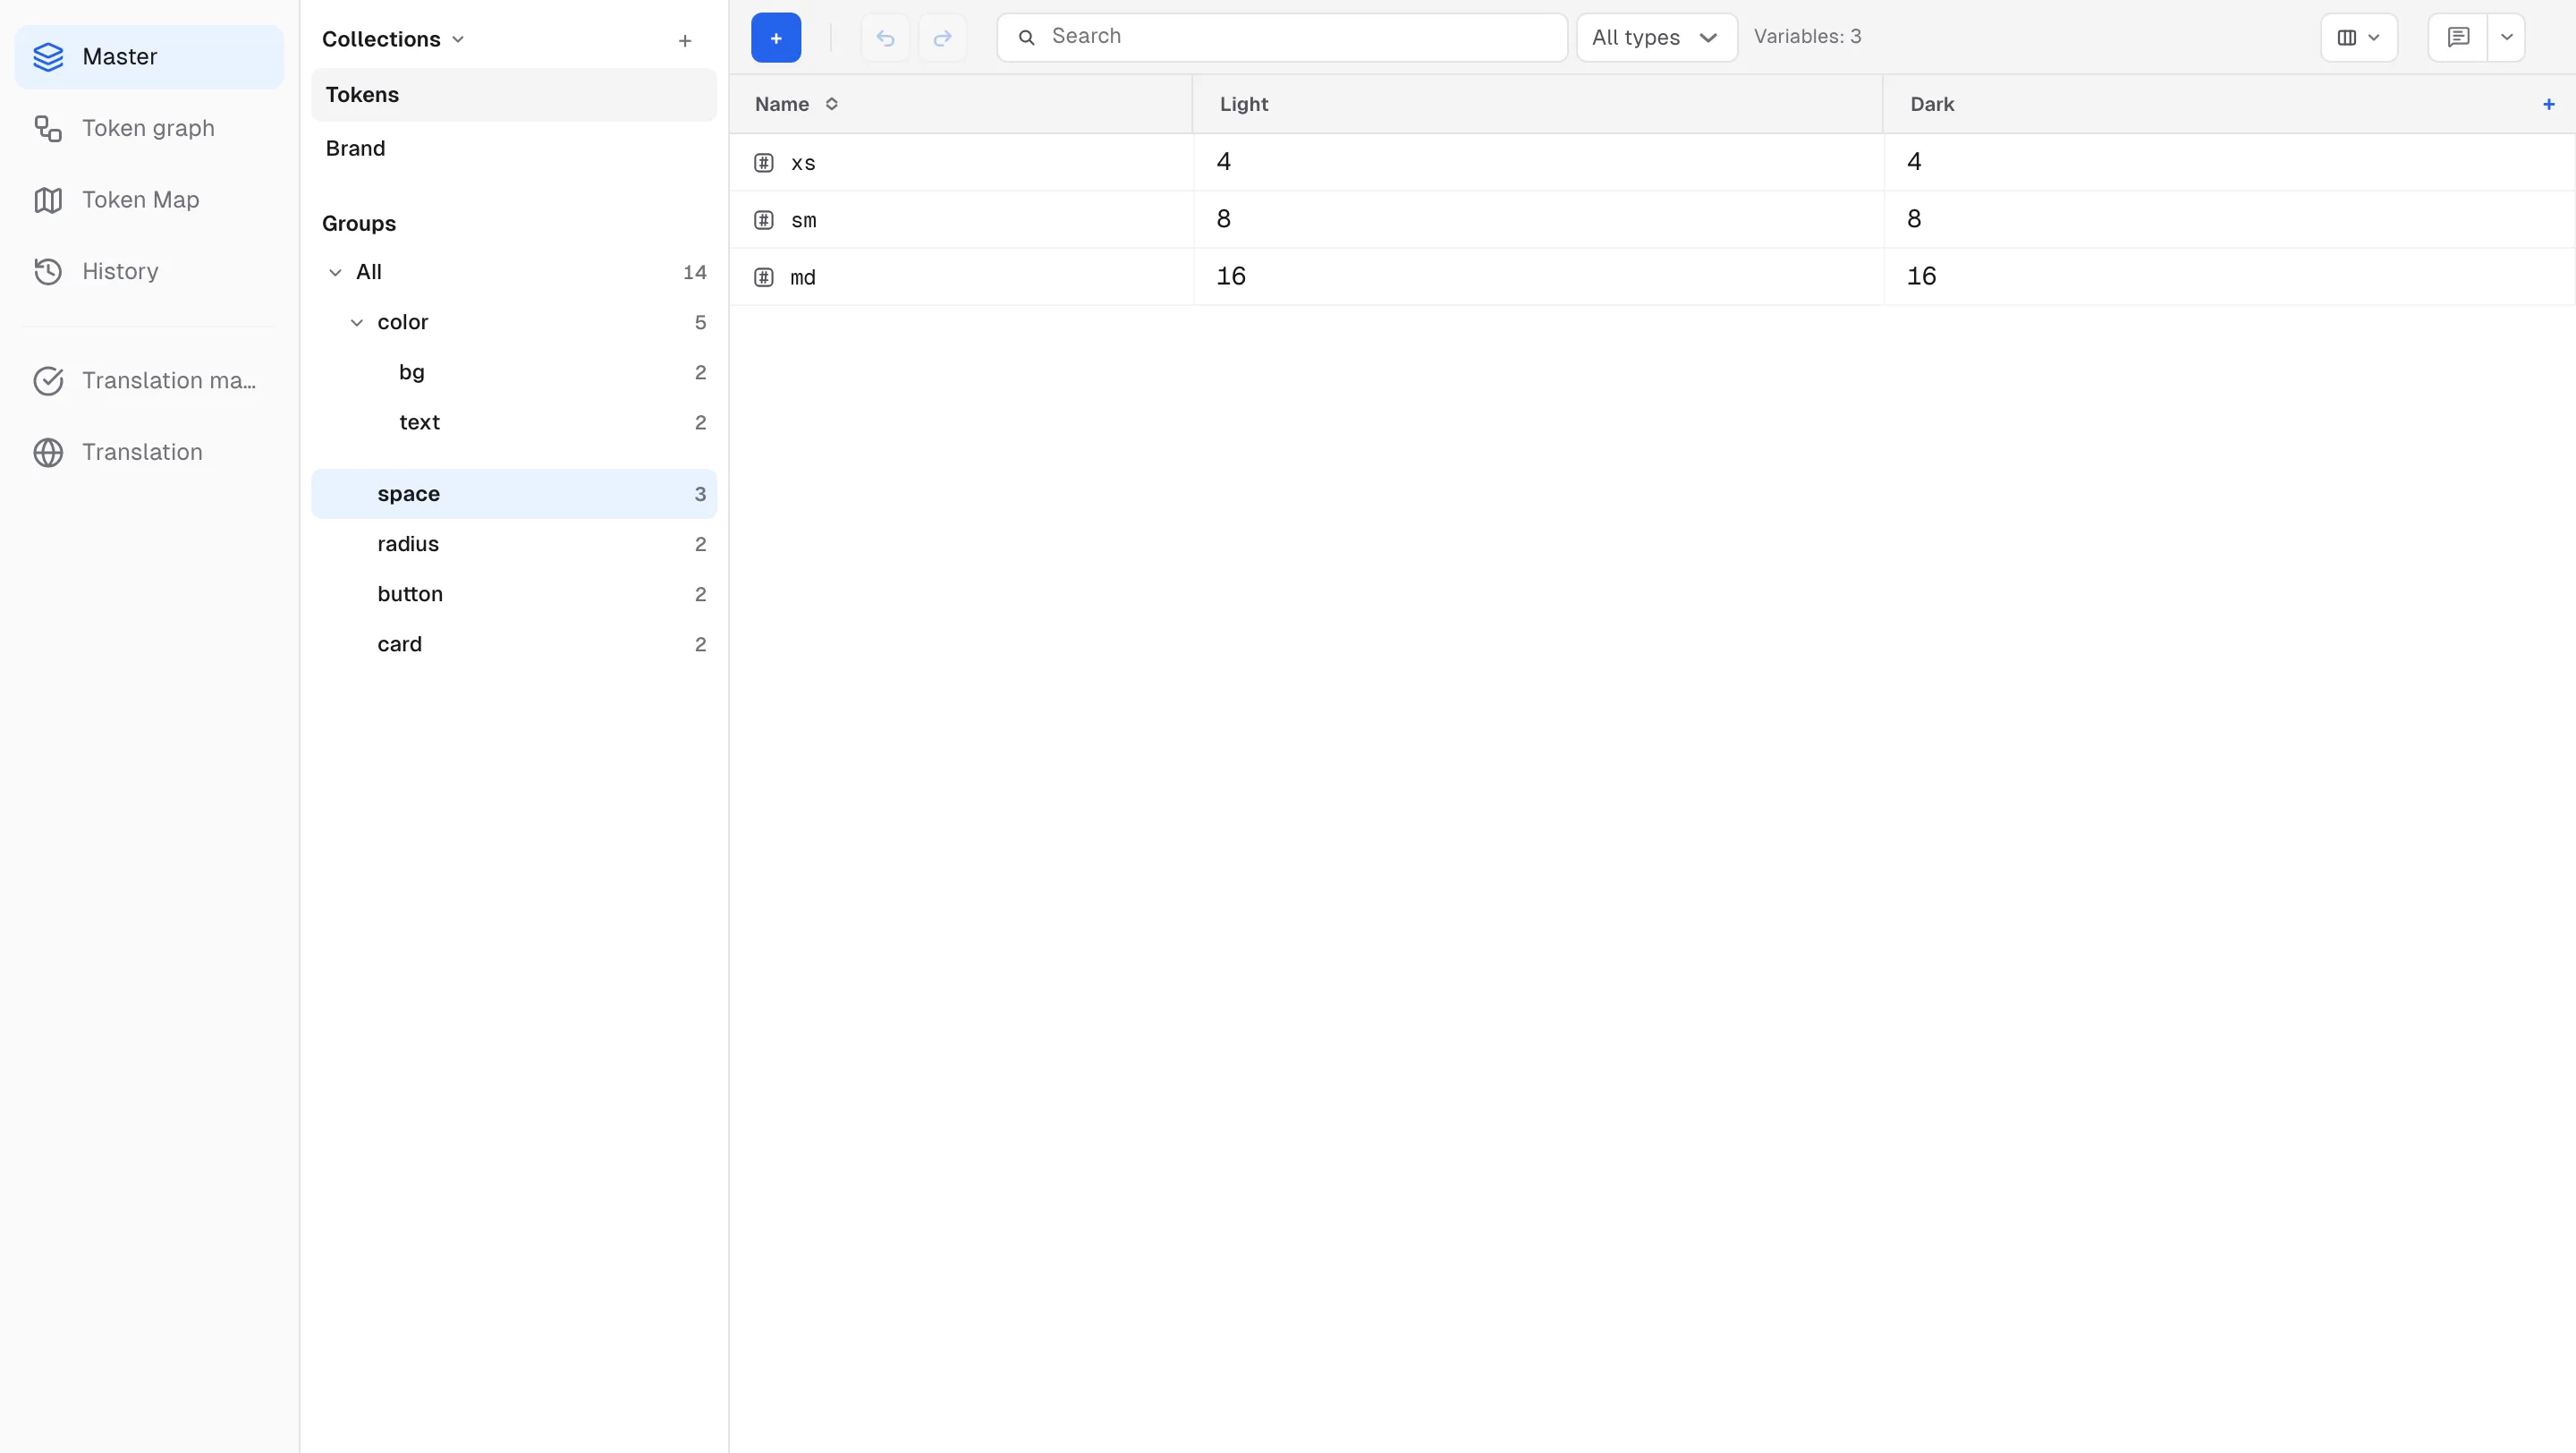
/in a variable name forms a group (e.g.color/primary→ thecolorgroup). Pick a group in the Groups tree to filter the grid to just that group; pick All to see the whole collection again.
Creating, renaming, and moving groups
- Select rows and right-click New group with selection — the selected variables are gathered into a group named New group. Rename it right away in the sidebar.
- Right-click a group in the sidebar and choose Rename to change the path of every variable in that group (subgroups included). Aliases that point at those variables follow automatically. A group name can’t be empty or contain
/. - Name cells in the grid show only the last segment; the group header carries the path. Double-click editing changes the last segment only — to edit the full path, use the Name field in right-click Edit variable.
- Drag a group in the sidebar onto another group (or onto All) to move its path under that target. Ctrl(⌘)+Z undoes it, and the same path reaches Figma after the next sync. You can’t drop a group onto itself, one of its own subgroups, or its current parent.
- There is no drag-to-reorder for groups or variables.
Editing cells
- Click a value cell to edit it. Enter confirms and moves down; Escape restores the original value.
- Input by type: string = text, number = numeric input, boolean = toggle switch, color = color picker + hex.
- Color cells show the hex without
#alongside an alpha%segment, like Figma. Short forms expand (f→FFFFFF), and in 8 digits the last two are alpha — the input hint reads “Hex, 6 or 8 digits (last 2 = alpha); short forms expand (f → FFFFFF); {reference} also works”. A value that isn’t a color is never saved: it reverts when you leave the cell, with a “Not a color, reverted: {value}” toast. - The color picker has Custom / Libraries tabs. On Libraries, pick another color variable in the same collection to link it as a reference (alias); Pick color from screen grabs a color from your screen.
- A cell that references another variable renders as a chip — the chip shows only the last segment, and hovering reveals the full path and the resolved value. Click the chip to reopen the picker and switch to a different variable.
- String and number variables can reference too. Hover the cell and use the Set alias button to pick a variable of the same type; all three types share the Detach alias button, which drops the reference and leaves the resolved value in place as a plain value.
- A choice that would form a loop is blocked in the picker (“Would create a circular reference”). Paste skips cells that would loop and says so in the toast (“{count} cells skipped (circular reference)”).
- Double-click a name cell to rename a variable.
- To leave a comment on a cell, press C and click the cell (Comments — “Press C, then click a cell. Stays on until you press Esc.”). Description, tag, and scope cells take comments too.
Adding, deleting, duplicating rows
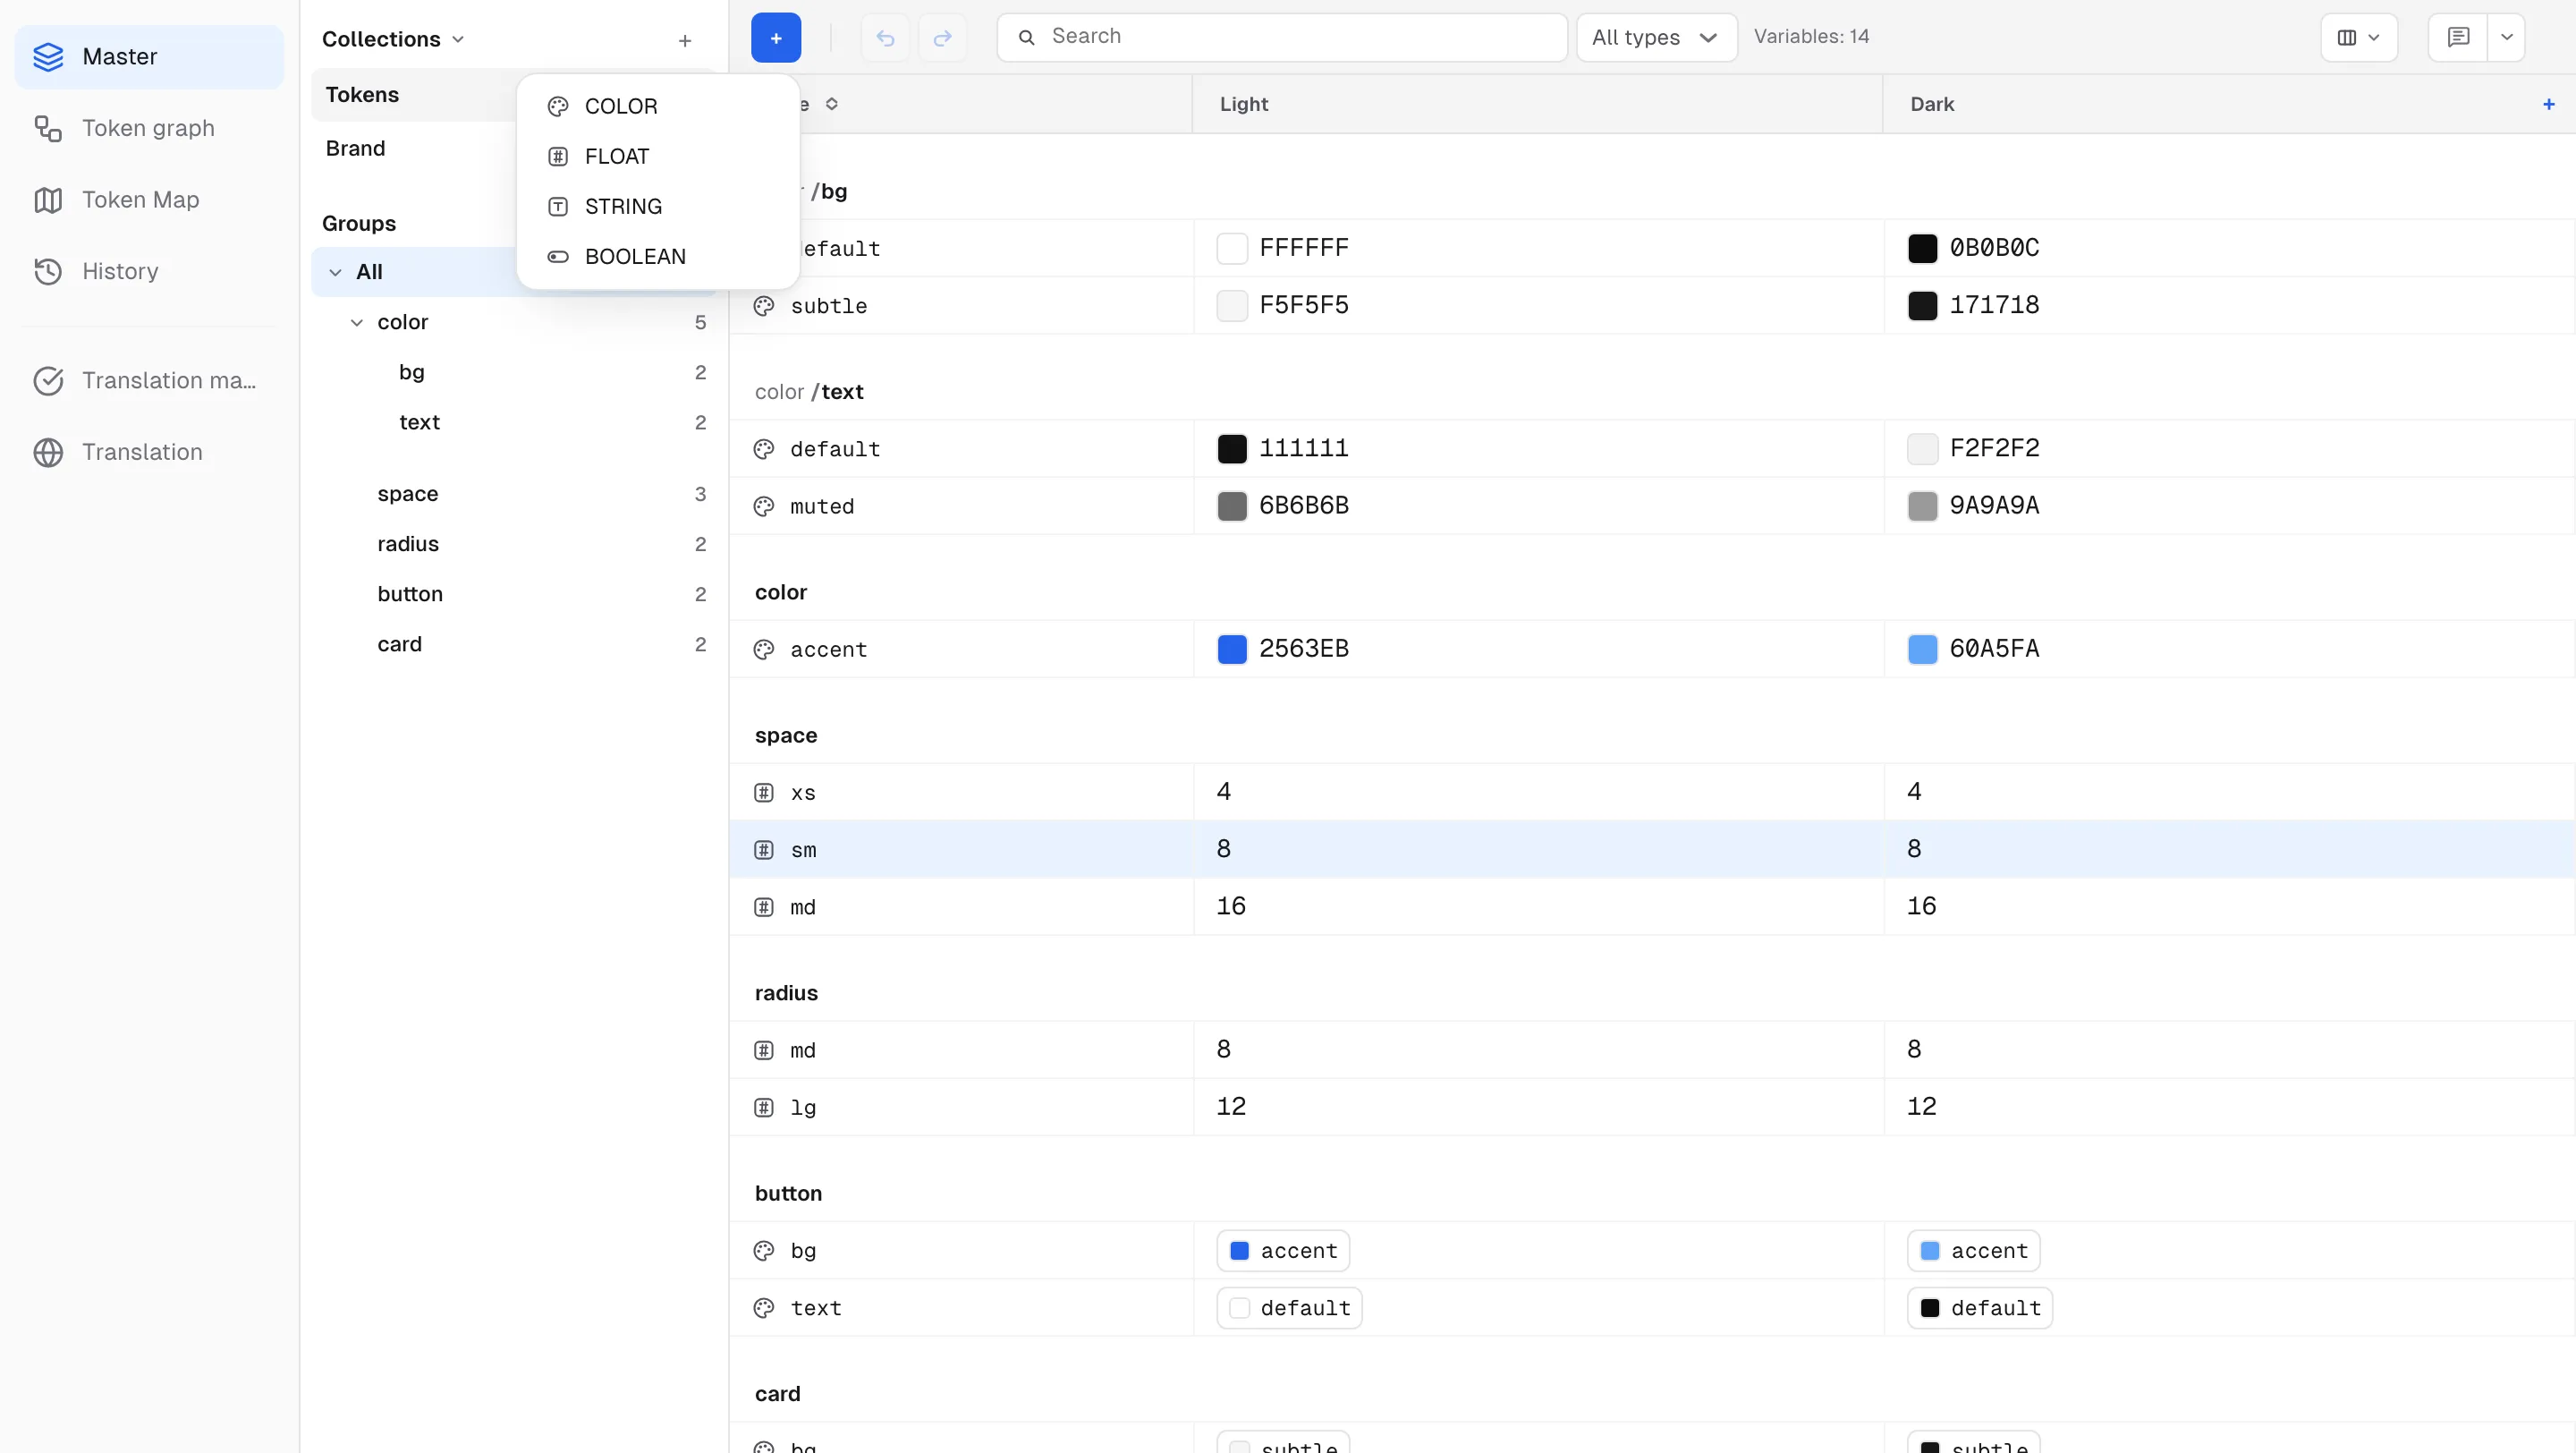
- Pick a type (COLOR / FLOAT / STRING / BOOLEAN) from the toolbar’s leftmost + (Add variable) and a row is created and focused on the spot. No name form first — the new variable is born with a per-type default value; rename it right there.
- To delete, select rows and press Delete, or use Delete in the right-click menu.
- Shift+Enter — on a single row, inserts a new row of the same type right below; with multiple rows selected, duplicates them.
- The right-click menu’s Duplicate works too.
- Row right-click menu: Copy · Duplicate · Edit variable · New group with selection · Move to collection ▸ (collection list + New collection) · View references · Export this collection · Delete.
Moving variables to another collection
- Select rows, right-click Move to collection ▸, and pick the target collection or New collection. If both collections have the same mode names, the rows move immediately.
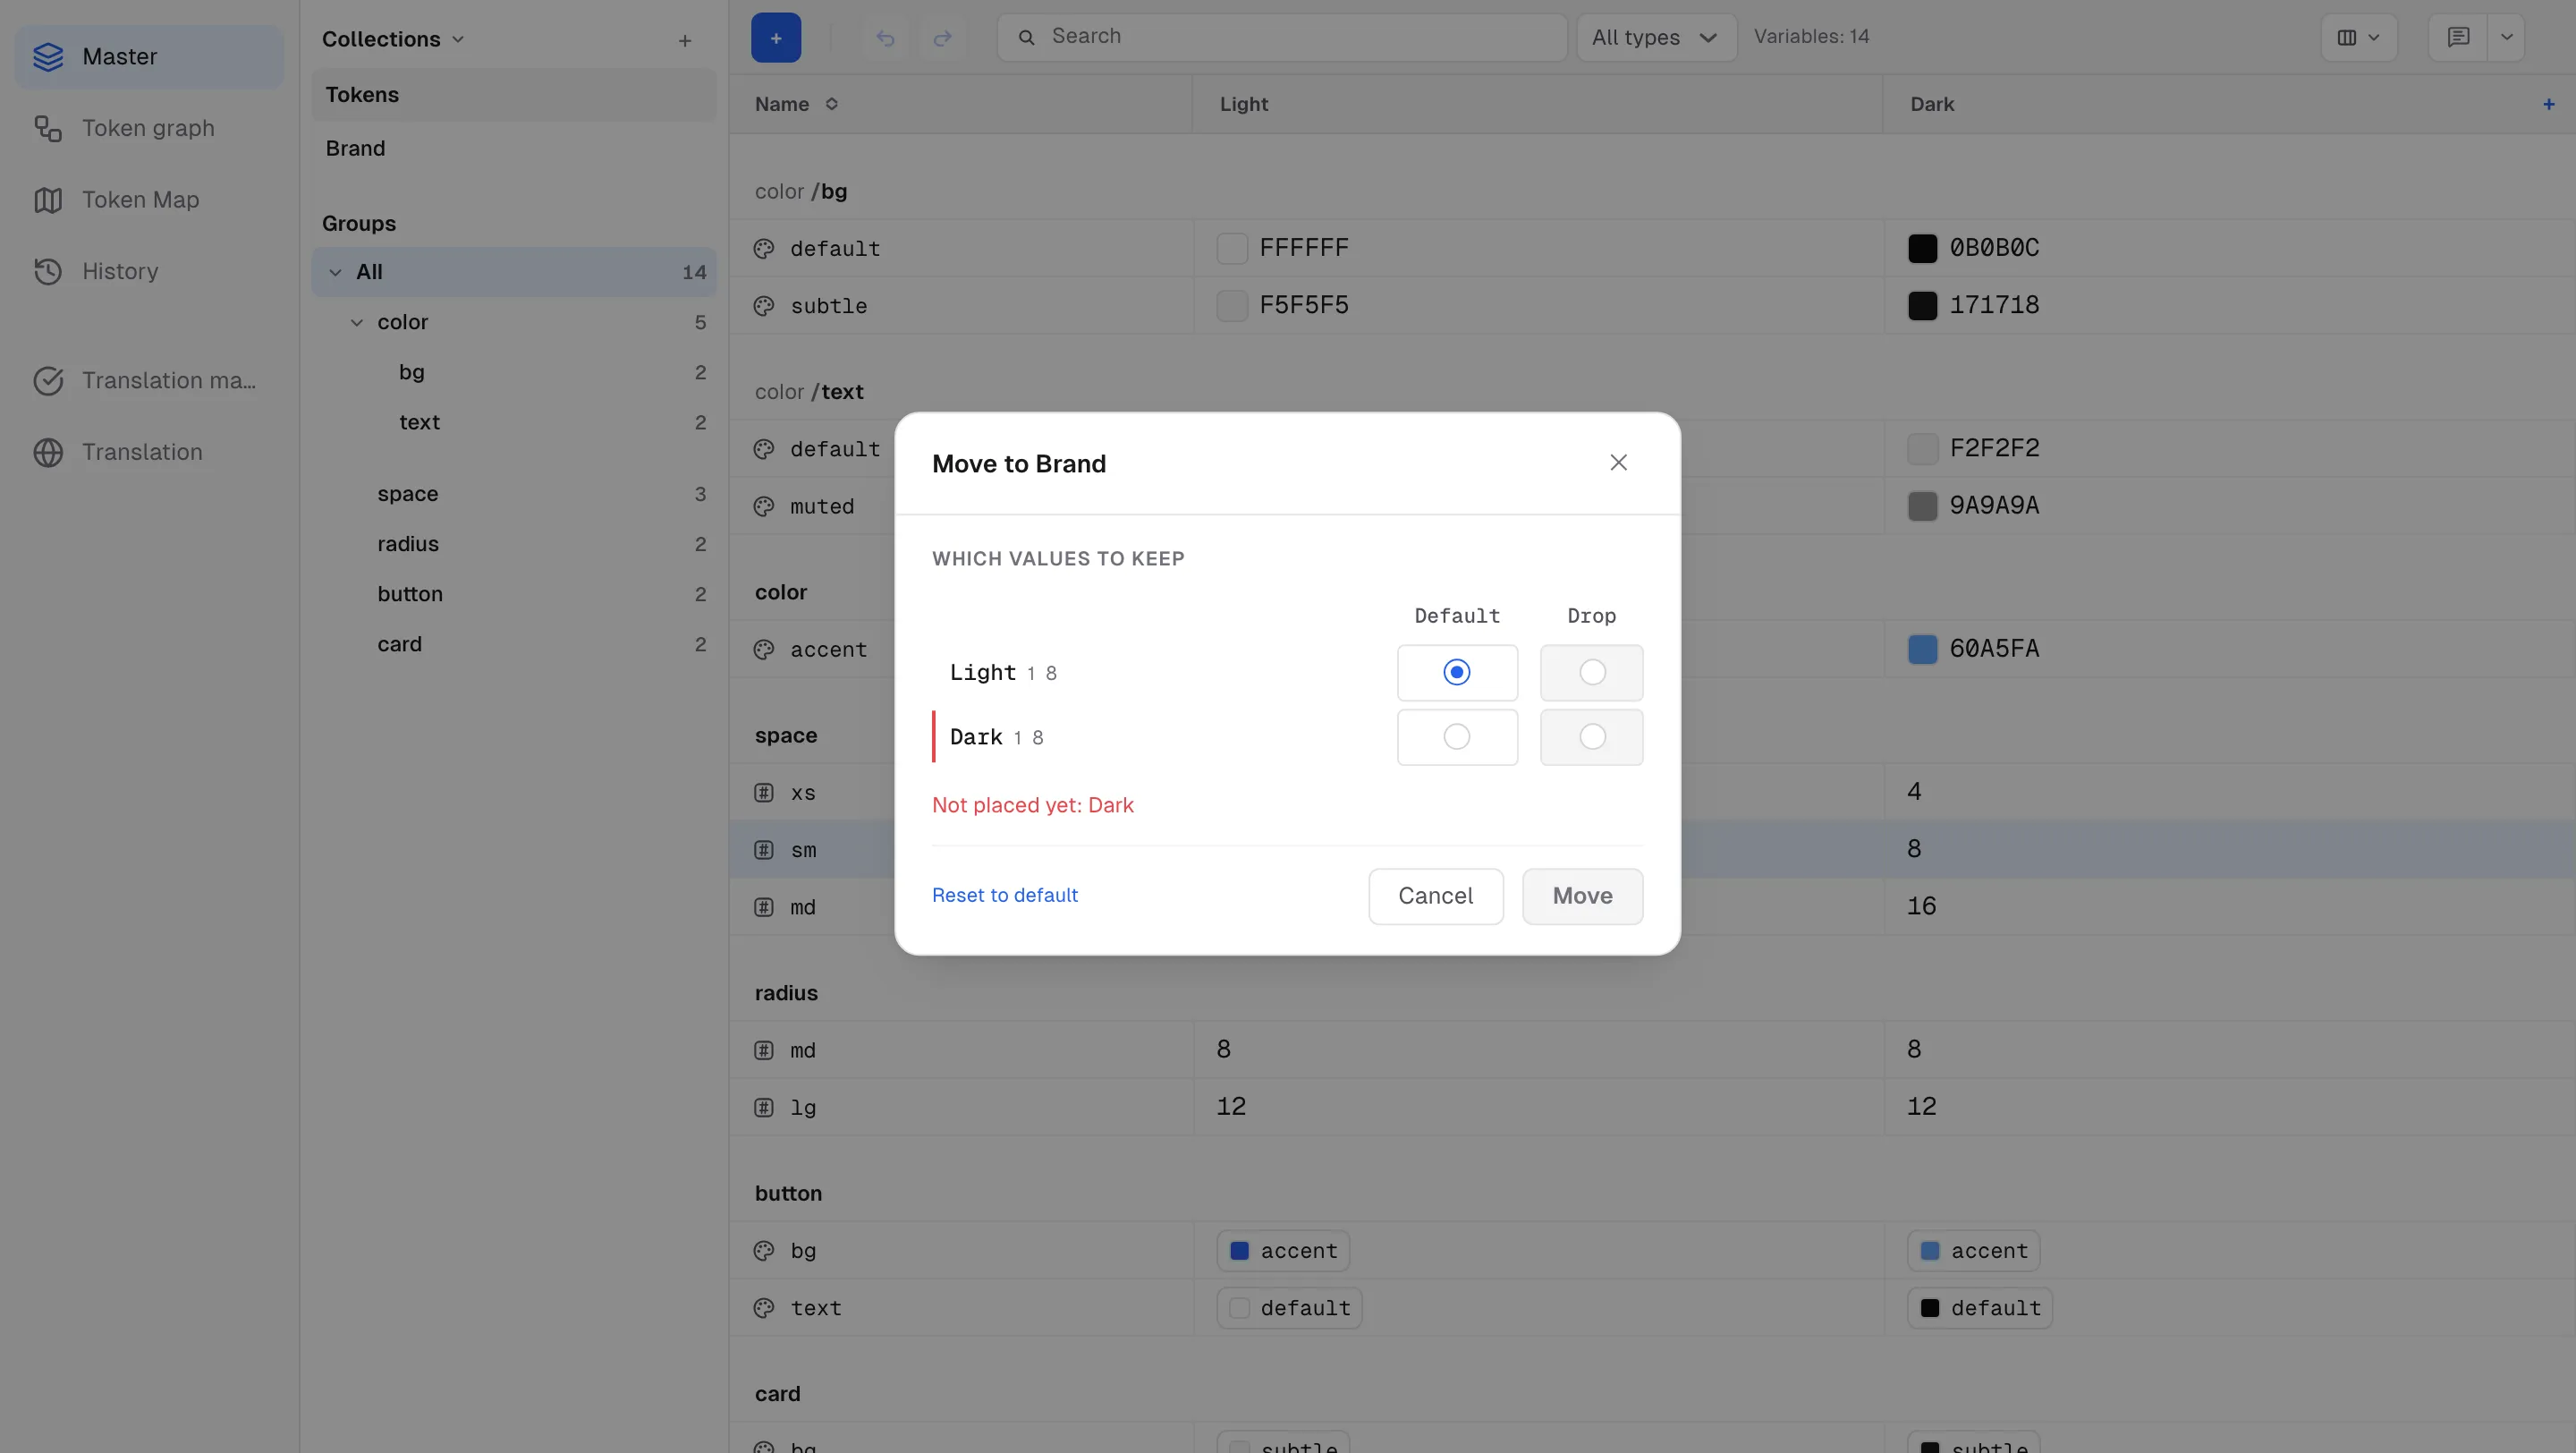
- If the modes differ, the Move to {collection} dialog opens with a Which values to keep board. For each mode of the current collection, seat its value in one of the target mode columns or choose Drop. While any mode is unplaced the button stays locked and the dialog says “Not placed yet: {modes}”. The button reads Move, or Drop {count} and move when a choice discards values — there is no separate confirmation. Reset to default restores the initial layout.
- After the move, a “Moved {count} variable(s) to {collection}” toast appears with Undo to reverse it immediately.
- In a project with a connected Figma file the dialog shows “Figma layers are re-linked on the next sync. Anything that can’t be re-linked is flagged on the row.” Moved rows carry a Waiting in Figma badge until you press Sync in the plugin, which creates the variables in the new collection on the Figma side and re-links the layers.
Multi-select — two modes
Row selection (full-row highlight) — for row-level operations:
- Shift+click: select a range from the last selected row
- Ctrl(⌘)+click: add/remove individual rows
- Shift+Ctrl(⌘)+↑↓: extend with the keyboard
- Available actions: right-click Copy (names and modes included) / Duplicate / Delete, the Delete key, Shift+Enter duplicate, New group with selection, Move to collection
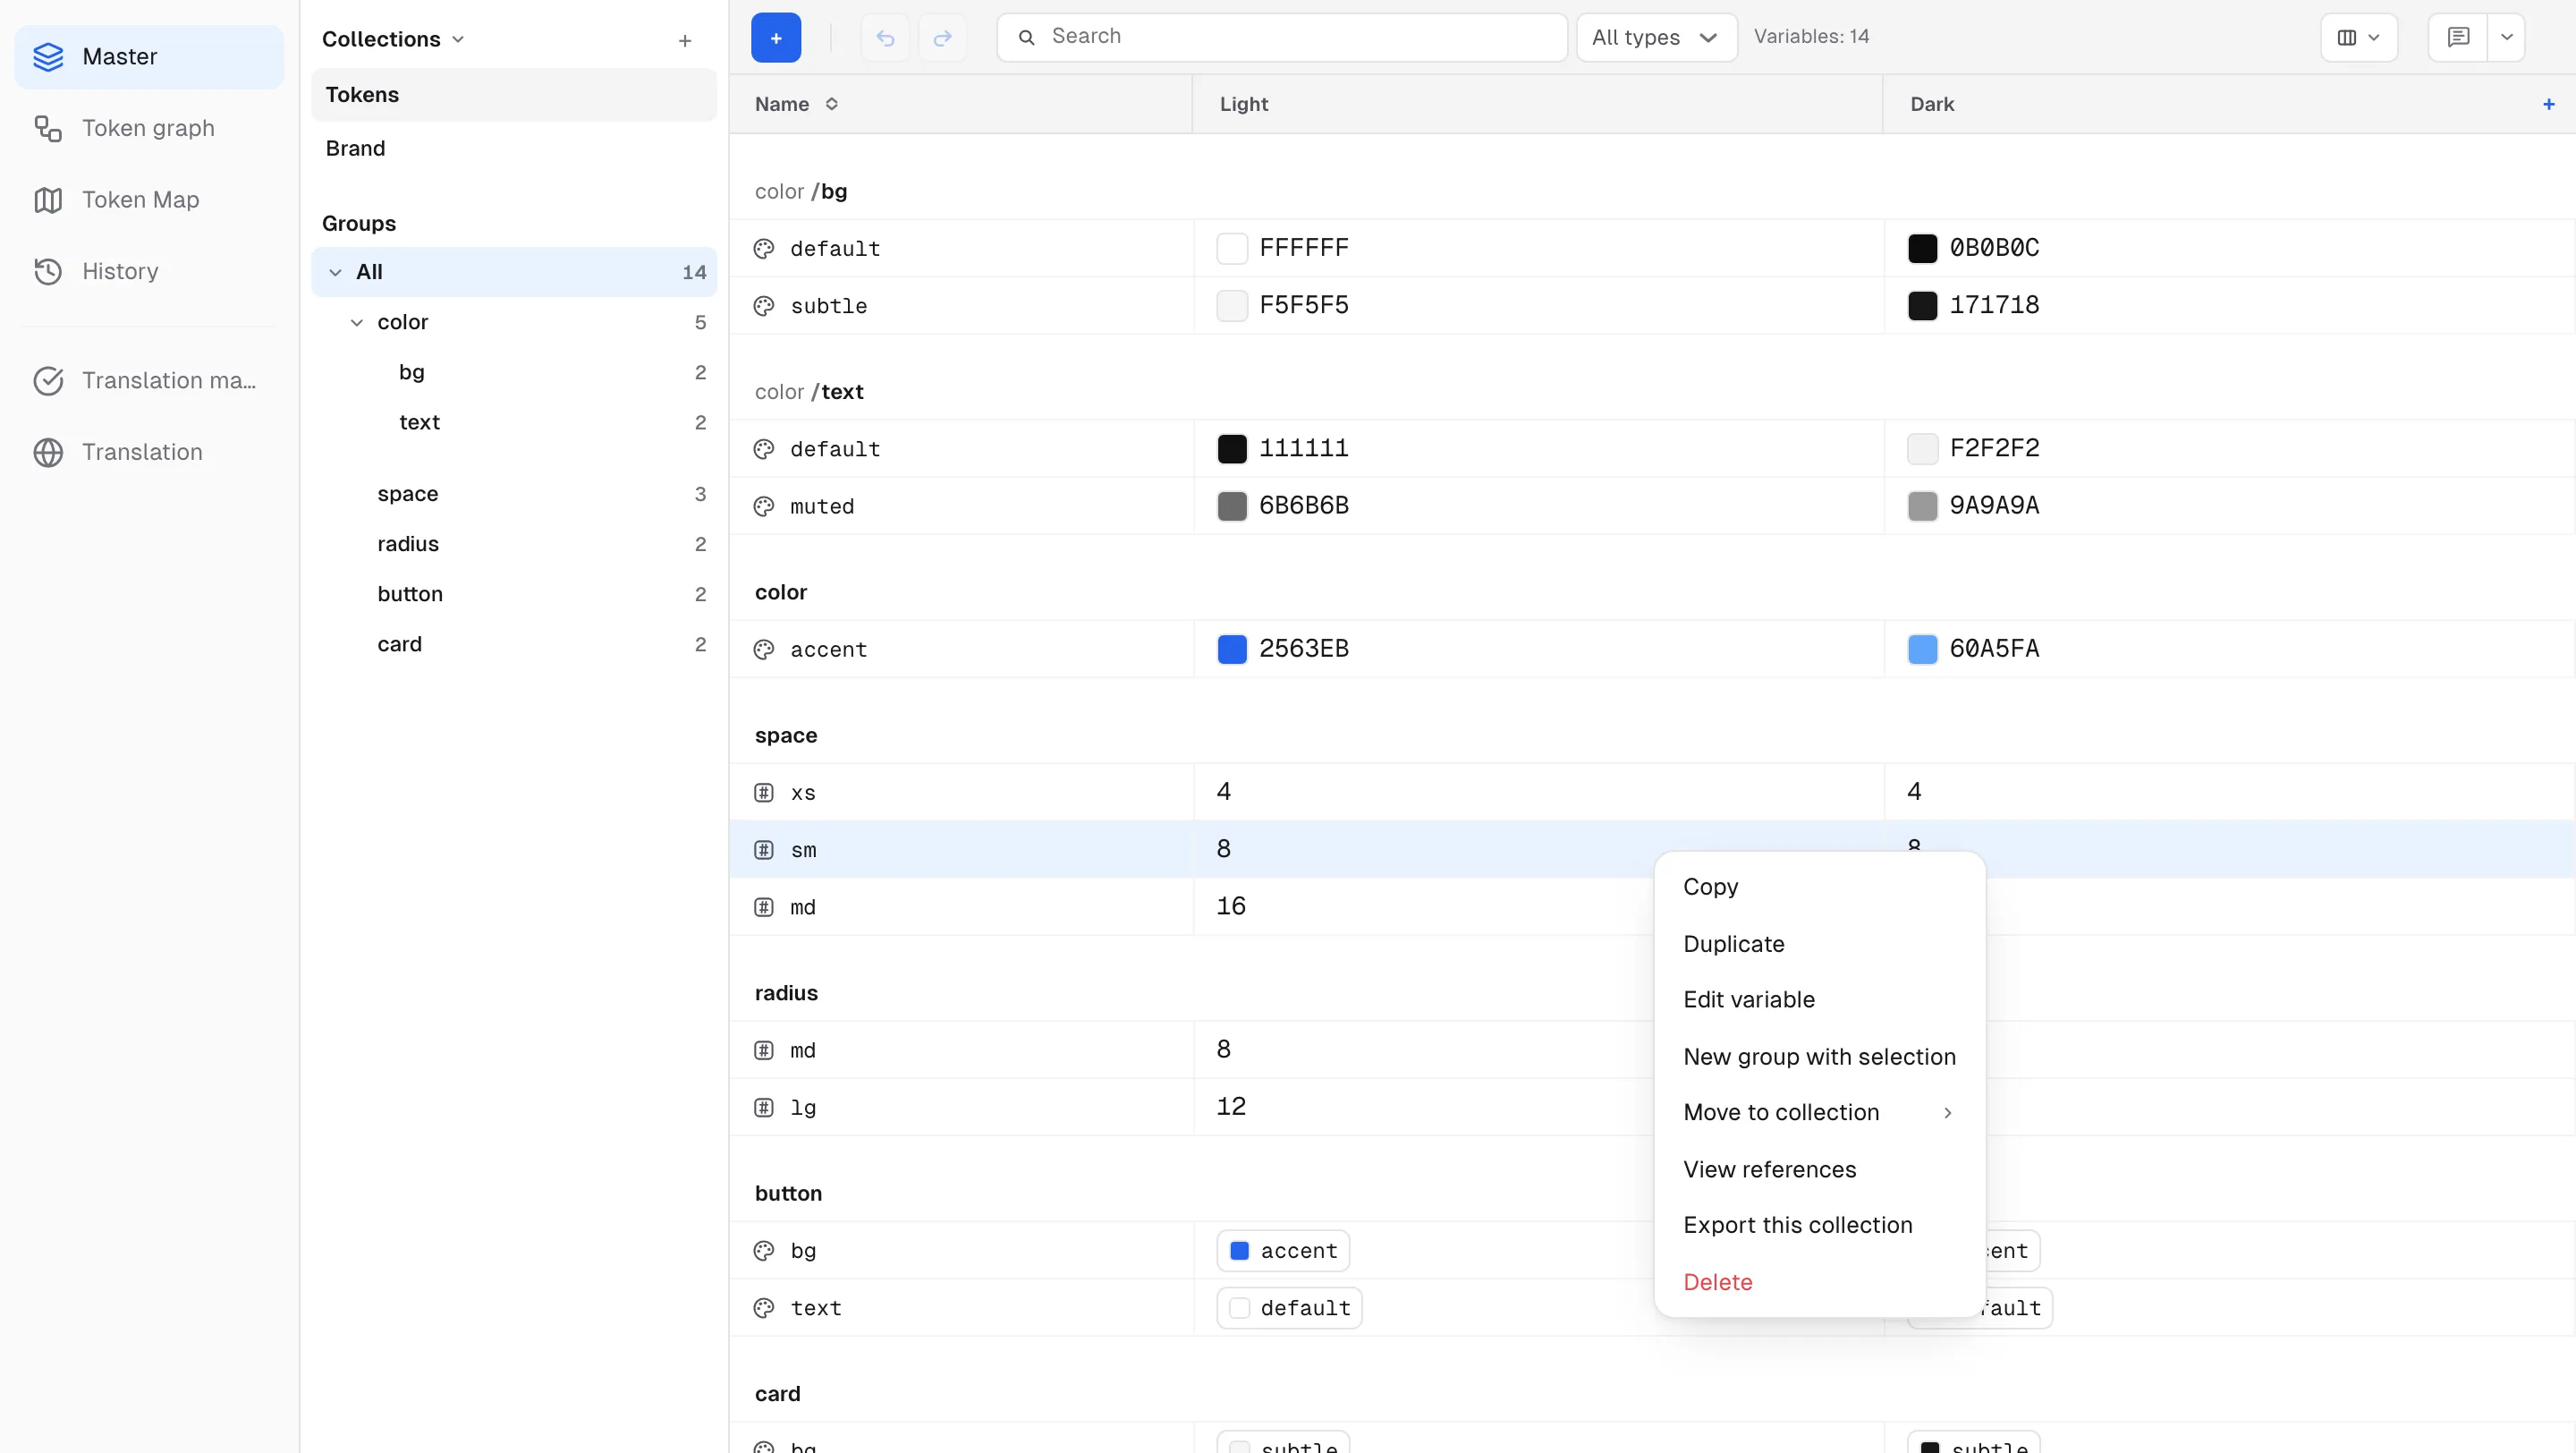
Cell range selection (dashed border) — for bulk value operations:
- Click a value cell to set the anchor, then Shift+click or Shift+arrow to extend a rectangle
- Available actions: batch input, Ctrl(⌘)+C copy, Delete to clear values
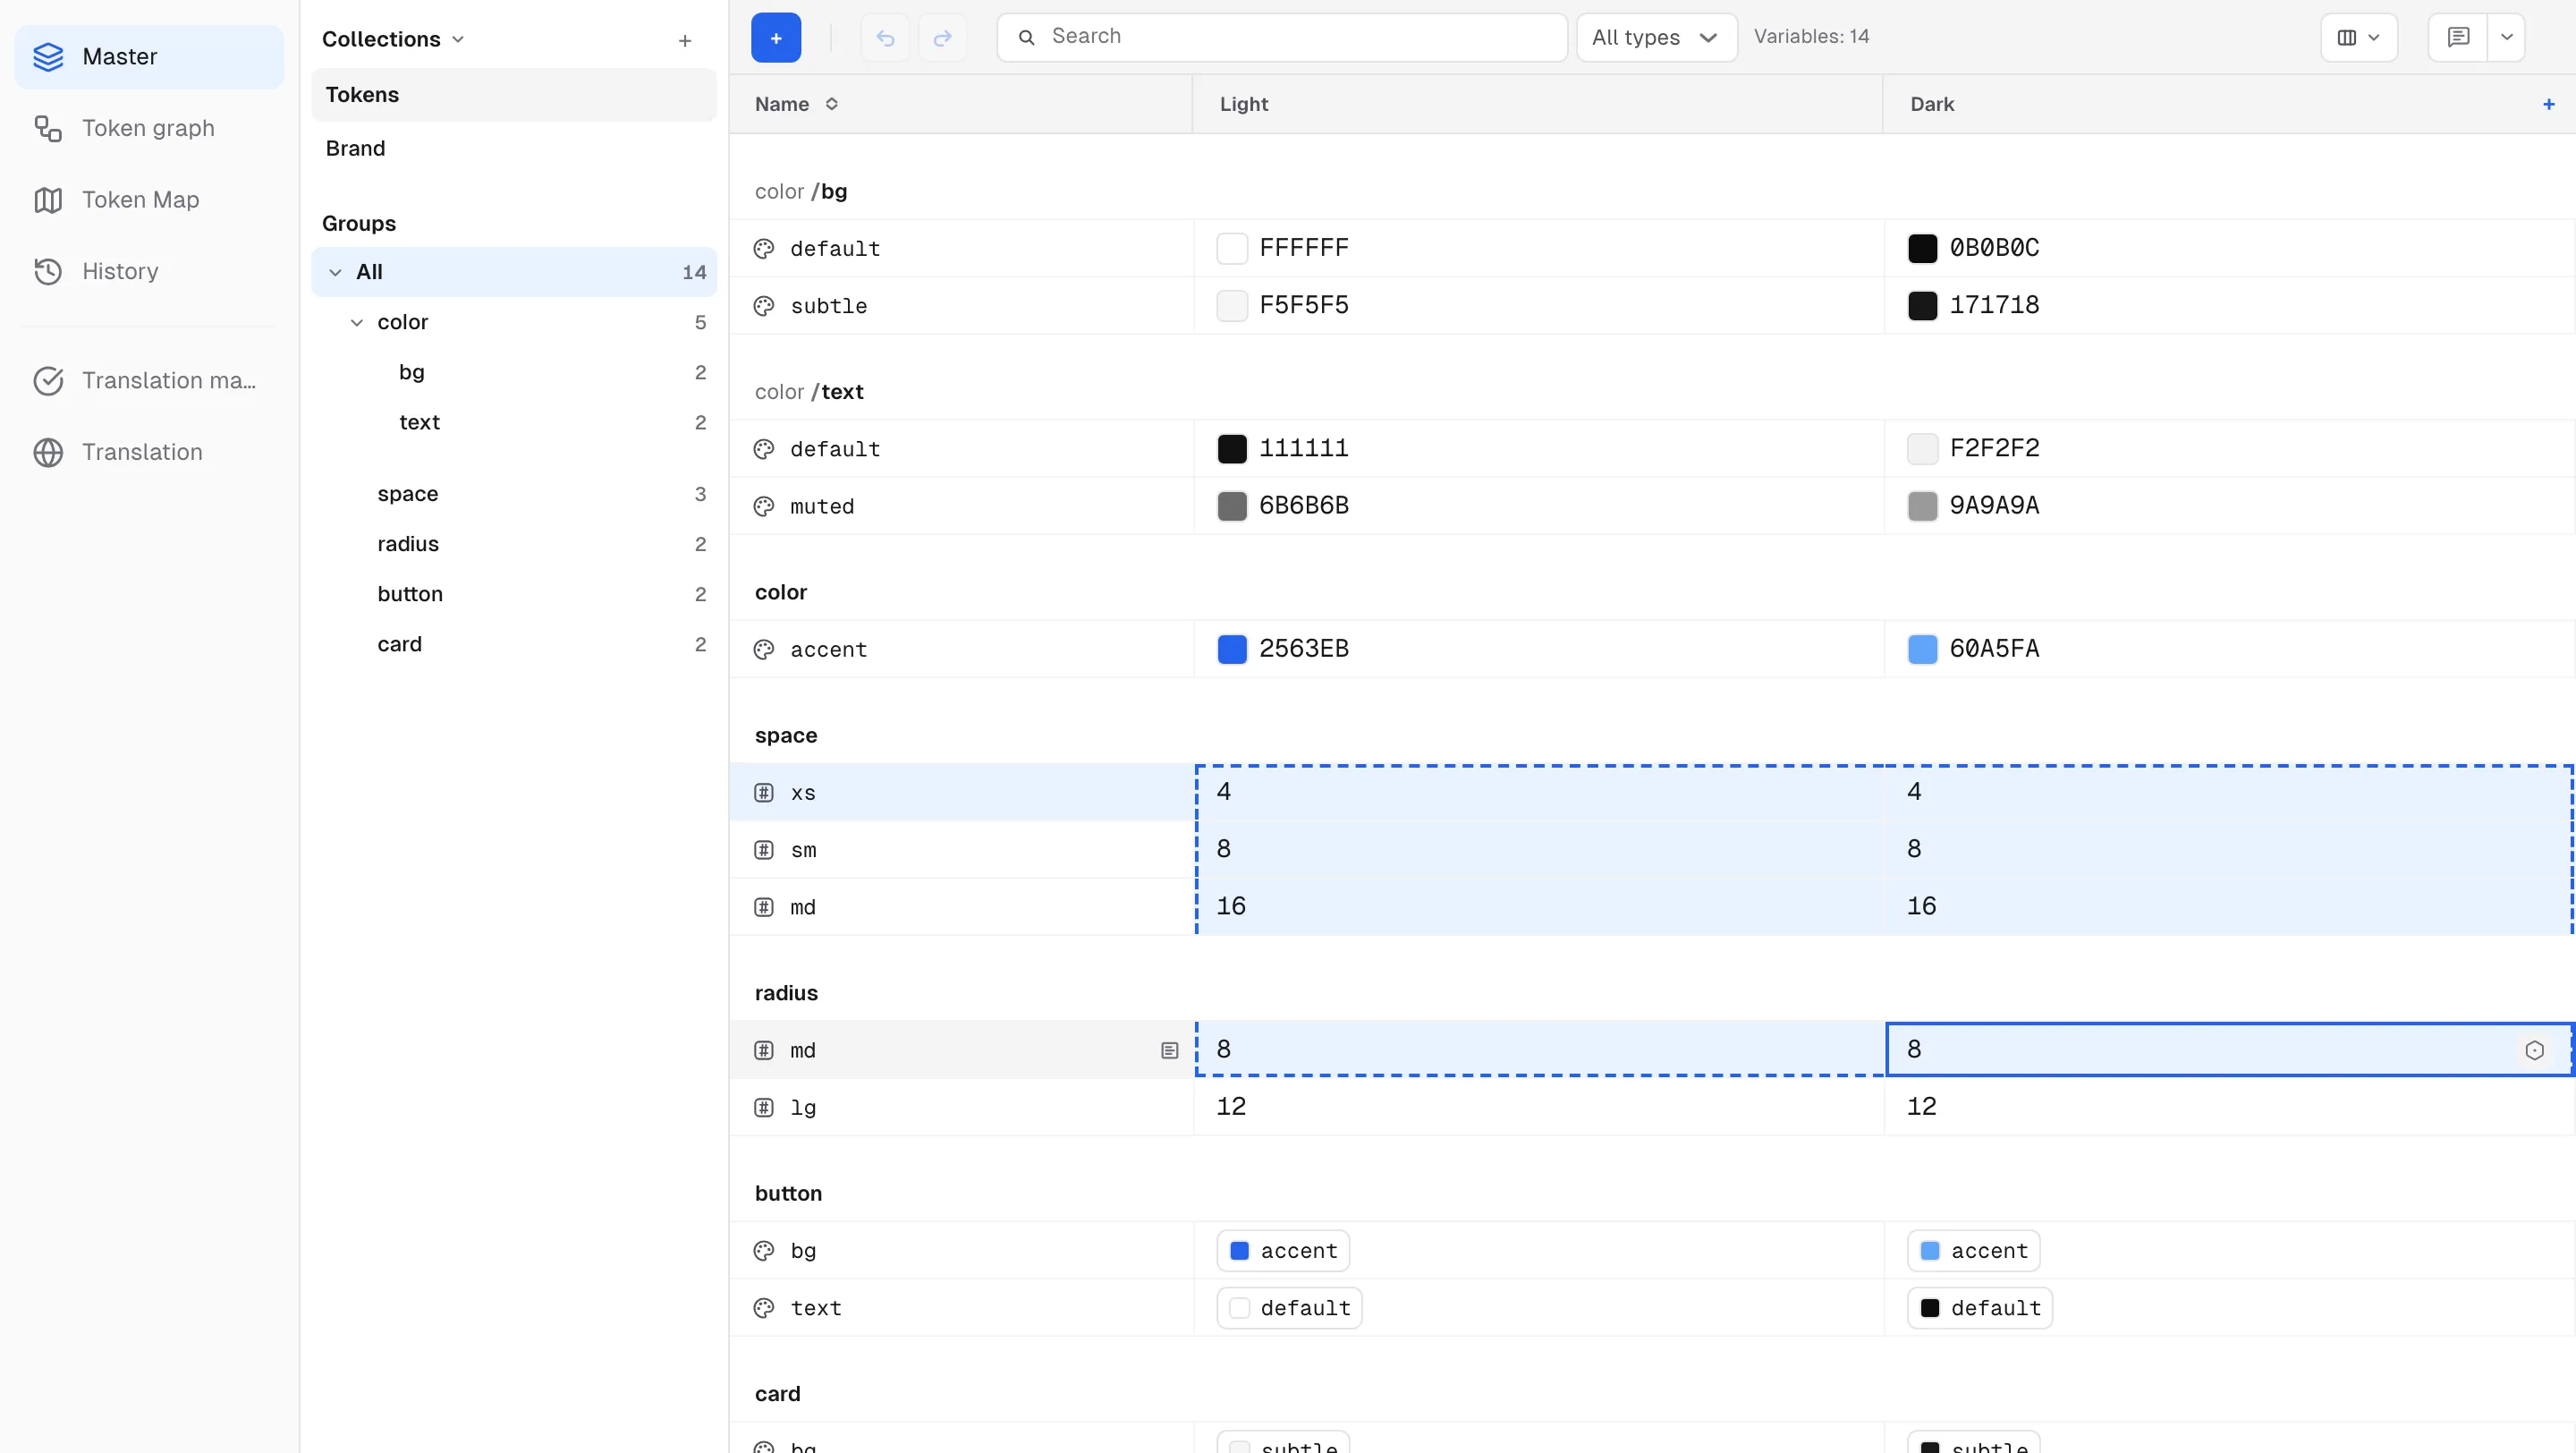
Batch input
With a cell range selected, just start typing — editing opens in the anchor cell, and Enter puts that value into every selected cell at once.
Copy & paste
You can move values between the grid and Google Sheets or Excel with copy/paste. Paste a table copied from a sheet into the grid, and copy grid values back out to a sheet.
Copy:
- Select two or more cells and press Ctrl(⌘)+C to copy their values.
- Select rows and right-click Copy to include the variable names and modes. Paste it into a sheet and you get a table.
Paste (Ctrl(⌘)+V): paste a table copied from a spreadsheet straight into the grid. Where it lands depends on your selection.
- A value cell is selected — filling starts at that cell and continues right and down. Rows and columns past the edge of the grid are skipped.
- No cell is selected — the first line is read as a header, and values are matched to existing rows by variable name and mode name. Variable names not in the grid are created as new rows (the toast shows “New variables: {count}”). Columns that don’t match are skipped.
Either way, a toast reports how many cells were filled and how many were skipped. Cells that would form a circular reference are skipped.
Pasting onto a selected value cell only fills existing rows — to create new variables as you paste, clear the cell selection and paste a table with a header line, or create rows first with + (Add variable). If search or a filter is active, only the rows visible in the grid are affected.
Undo / Redo
Ctrl(⌘)+Z to undo, Ctrl(⌘)+Shift+Z to redo (up to 50 steps). Toolbar buttons are available too. Edits, deletions, pastes, batch input, and group renames and moves can all be undone.
Managing modes (columns)
- Add modes with the + button (Add mode) at the right end of the last mode header. At your plan’s language limit, an upgrade prompt appears.
- Double-click a mode header to rename, or use the right-click menu’s Rename / Delete. The last remaining mode can’t be deleted.
- Drag a column edge to resize — widths are saved for next time.
Search and sort
The toolbar has a search box and type filters (All types · Color / String / Number / Boolean). Click the Name · Description · Tag · Scopes header to sort by that column; click again to flip the direction. Sorting applies inside each group section only — the order of the group sections themselves stays put.
The View — columns & color button in the toolbar turns the Modes · Description · Tag · Scopes columns on and off (the menu stays open so you can toggle several) — covered in Variable metadata.
Keyboard shortcuts
| Key | Action |
|---|---|
| Enter | Confirm value + move down (fills the whole range during cell-range selection) |
| Escape | Cancel edit → clear cell range → clear row selection |
| Tab / Shift+Tab | Move between mode columns (wraps across rows) |
| ↑↓ (while editing) | Move to the cell above/below in the same column |
| ←→ (cursor at start/end of value) | Move to the adjacent mode column |
| Shift+arrows | Extend cell range |
| Shift+Ctrl(⌘)+↑↓ | Extend row selection |
| Shift+click / Ctrl(⌘)+click | Select row range / toggle individual rows |
| Shift+Enter | Insert new row (single) / duplicate rows (multi-select) |
| Delete / Backspace | Clear cell-range values / delete selected rows |
| Ctrl(⌘)+C | Copy the selected cell values |
| Ctrl(⌘)+V | Paste |
| Ctrl(⌘)+Z / Ctrl(⌘)+Shift+Z | Undo / Redo |
| C, then click a cell | Add comment (Esc to exit) |
Token graph
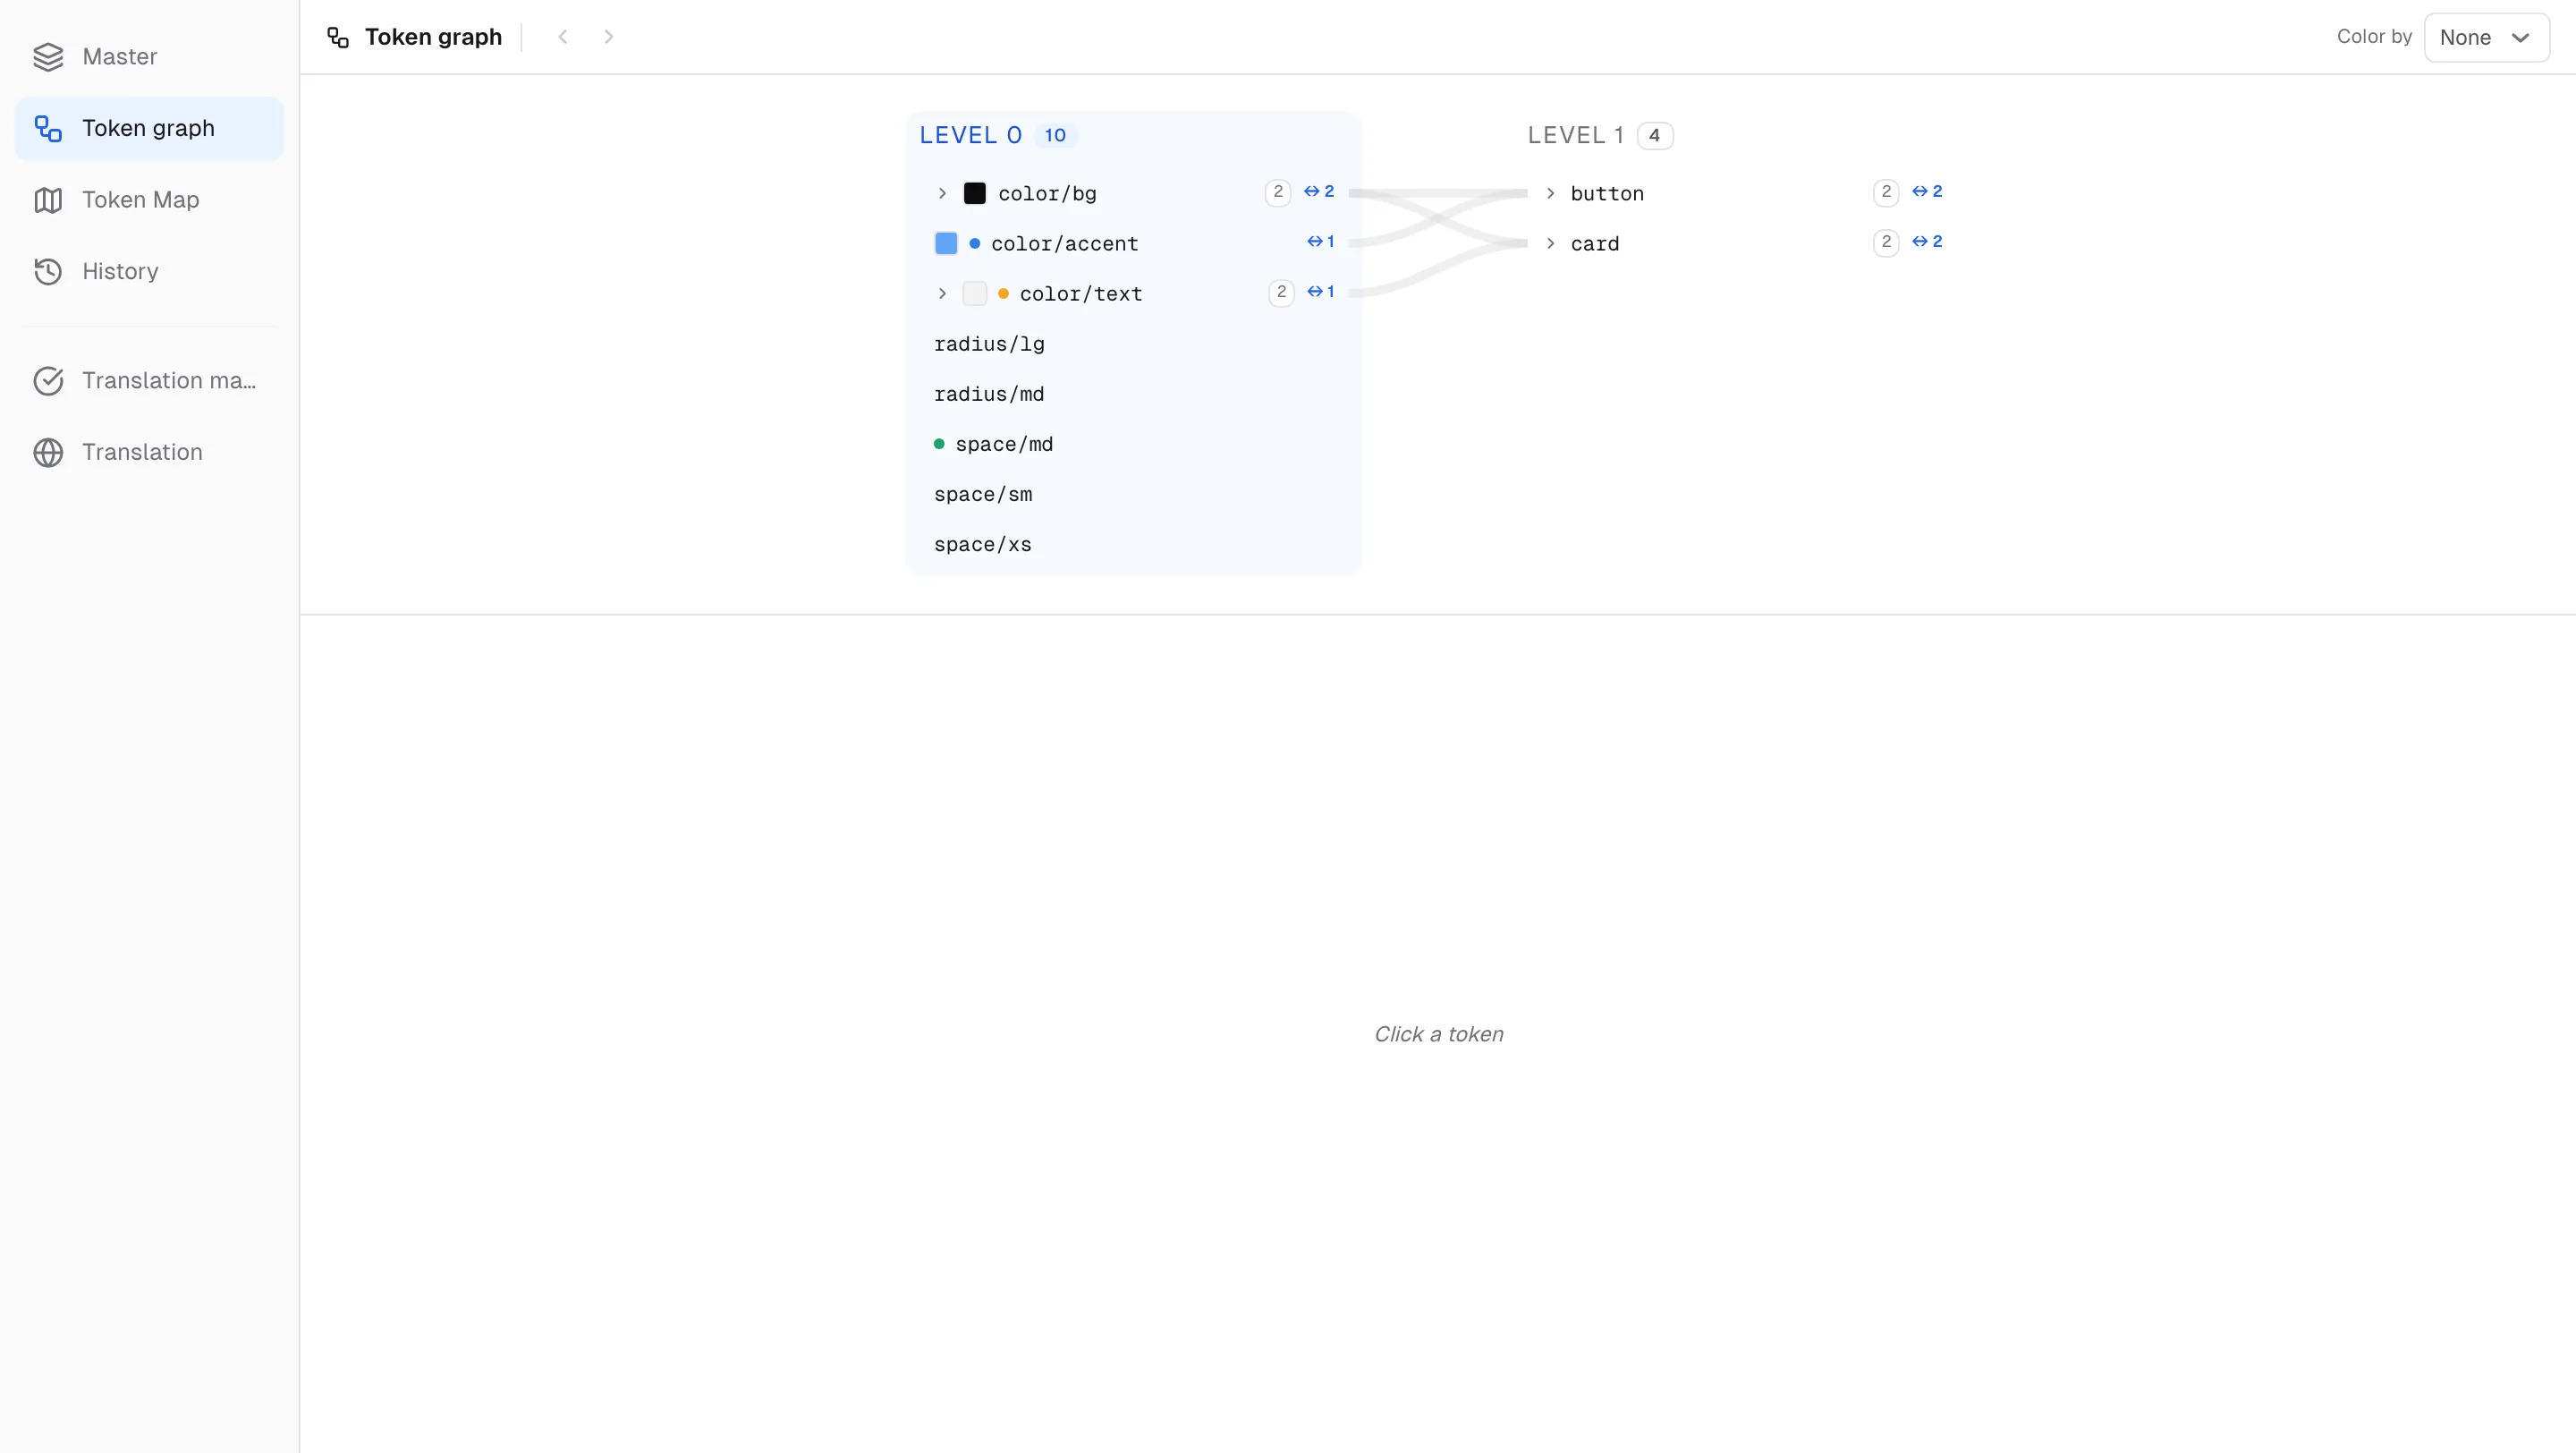
A project’s Token graph tab visualizes reference (alias) relationships between variables one step at a time, and the Token Map tab lays the whole project out as a single map. Click a token in the graph and the summary shows “Changing this affects {count}” and “References {count} values”, so you can see the blast radius before you edit. From the grid, right-click a row and choose View references to jump straight there. See Token graph for the full guide.
Exporting data
Export straight from the web — Export in the project card’s ⋮ menu, or right-click a collection in the sidebar or a grid row and choose Export this collection. Six formats are available (DTCG · JSON · CSV · CSS · SwiftUI · Jetpack Compose); see Export & code for details. The Figma plugin’s More (…) → Export also saves a file. To pull design tokens from code or CI, use the read-only API and the MCP server.